 Change Language ▼
LCG Trader includes a full suite of technical indicators that can be applied to your charts to assist you in identifying the best time to enter the market.
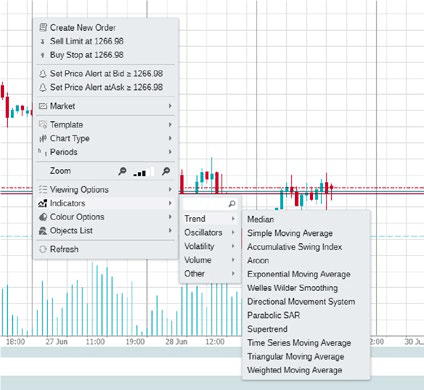
The wide range of indicators available includes trend indicators such as Moving Averages and Parabolic SAR, oscillators such as Moving Average Convergence Divergence (MACD) and Relative Strength Index (RSI), volatility indicators like Bollinger Bands and Standard Deviation, and many more.
To apply an indicator to an active chart, simply right-click on the chart and select ‘Indicators’ from the menu that appears.
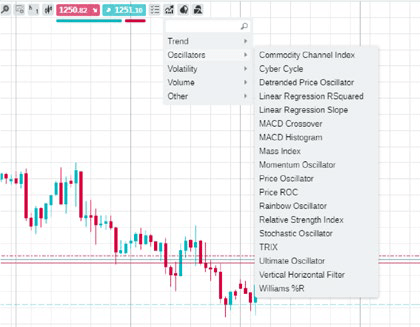
Alternatively, you can click the ‘Indicators’ button that is visible at the top of the chart. You can then choose between ‘Trend’, ‘Oscillators’, ‘Volatility’, ‘Volume’ and ‘Other’ or simply search for your preferred indicator using the field provided. Once you have found the indicator you wish to use, clicking on it will open a new window.
From here, you will be able to configure the setting used for the indicator, as well as how it will appear on the chart. The settings available differ for each indicator.
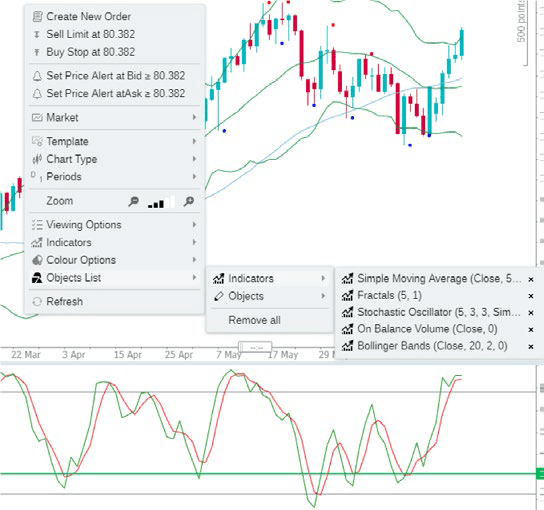
Indicators that have been applied to a chart can be removed in various ways. For indicators such as Parabolic SAR and Bollinger Bands, which are applied directly on the chart, right-click and select ‘Objects List’ from the menu. From there, select ‘Indicators’ and remove the desired indicator by clicking ‘x’ next to its name in the list that appears.
Alternatively, you can click ‘Remove All’ to delete all the indicators that have been applied. For indicators such as RSI, which appear below the active chart, you can click the ‘x’ icon at the top right of their window to remove them.