Change Language ▼
CFDs and spread bets are complex instruments and come with a high risk of losing money rapidly due to leverage.71% of retail investor accounts lose money when trading CFDs with this provider.
You should consider whether you understand how CFDs work and whether you can afford to take the high risk of losing your money.
Financial market research and analysis
Our analysts have their fingers on the pulse of the world's financial market news.
Spread betting and CFD trading are high risk and may not be suitable for everyone. You can lose all your deposits.
15 Jul 2016
By Mauro Fellner
BoE on hold pushes GBP above 1.34
The Asian stock markets soared for the fifth session in a row (Nikkei +0.68%, Hang Seng +0.24%). This week the fall in Japanese Yen is the worst since 1999, the currency is getting softer on the expectation that Prime Minister Shinzo Abe, together with the Bank of Japan monetary policy, would add more stimulus to the economy. USDJPY surpassed the 105.50 and is testing the 50-day moving average, above this level the pair could extend gains up to 107.58 (Fibonacci retracement). A break below the 105.00 mark support could cause the pair to slide to 104.26 (Fibonacci retracement).
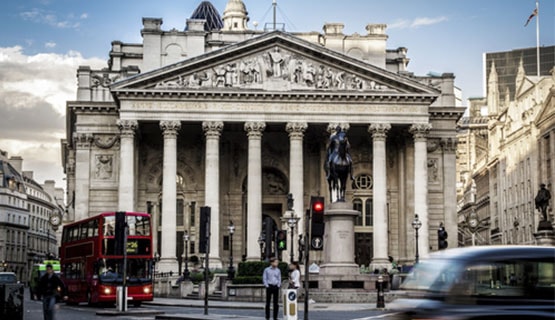
The market was surprised by the Bank of England’s decision not to cut interest rates at the July meeting. It was noted that economic condition were not justifying a rate cut in July, and according to the data the BoE will see coming in the next few weeks, we could expect some action in August. GBPUSD pushed higher to test the 1.3400 mark, and the momentum is confirmed by the MACD that has crossed in oversold territory, providing a buy signal. The next resistance is the 1.3415 (Fibonacci retracement) and if this is surpassed we could see Cable going even higher to 1.3500 then heading to the 1.3600 mark. First support is the intraday low 1.3325, and below this level the pair could retrace to 1.3300. If this is broken we could see a new slump to 1.3200 then 1.3105 (July 14th low).
Australian dollar soared on Friday, and the AUDUSD reached a new intraday high at 0.7675. The pair then bounced back right above 0.7650. The next resistance level is seen at the 0.7700 mark then above that level the pair could rally to 0.7834 (April 21st high). The first support is in the 0.7600/0.7594 area (Fibonacci retracement), if this is cleared we could see a slump to 0.7500 then to 0.7475 (100-day moving average).
Gold has tanked 40$ from the beginning of the week, while investors have been risk-on during the same time. The global stock markets are keeping the upside momentum, and, despite no interest rate cut in UK this month, the central banks are seen ready to act to ease market conditions. Gold is trading at 1333$ an ounce, on the side-lines, the next support is at 1300$ and below that the price could slide to 1296$ (Fibonacci retracement) and even lower to 1284$ (50-day moving average). The first resistance is at 1346$ (July 14th high) and if this is surpassed the yellow metal could soar to 1374$ (July 11th high).
During the Asian hours on Friday the Crude oil futures fell on concerns about a global oil glut, then the better than expected growth data from China, helped the price to retrace a bit higher. WTI is testing the support at the 45.00$ mark, and if this is broken the price could slide to 44.40$ (July 11th low). The first resistances are seen at 45.42/44.48$ (100-hour and 50-hour moving average) if these levels are cleared we could see a new rise towards 45.83$ (Fibonacci retracement), and extension towards 46.00$ and 46.73$ (Fibonacci retracement).
The information and comments provided herein under no circumstances are to be considered an offer or solicitation to invest and nothing herein should be construed as investment advice. The information provided is believed to be accurate at the date the information is produced. CFDs are complex instruments and come with a high risk of losing money rapidly due to leverage. Please note that 71% of our retail investor accounts lose money when trading CFDs. You should consider whether you understand how CFDs work and whether you can afford to take the high risk of losing money.